How Gantt Charts Work: A Visual Guide to Project Management Timelines
A Gantt chart is a visual project management tool that displays activities against time, helping teams track progress and manage dependencies. Each task appears as a horizontal bar on the chart, with activities listed on the y-axis and time shown on the x-axis.
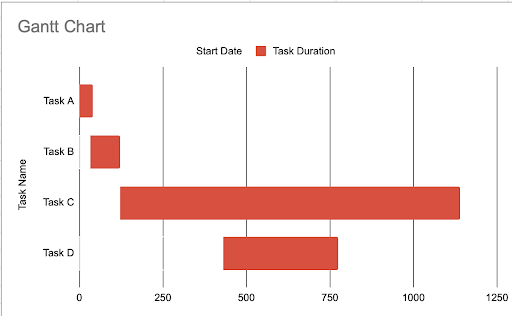
Red project timeline Gantt chart
Core Components:
- Projects and tasks (color-coded for clarity)
- Timeline (start and end dates)
- Status bars (showing progress)
- Supplemental information (priorities, owners, contacts)
Key Benefits:
- Clear visualization of project timelines
- Easy identification of task dependencies
- Improved resource allocation
- Better project communication
- Real-time progress tracking
Limitations:
- May oversimplify complex projects
- Doesn't show contextual task importance
- Cannot drive decisions alone without proper context
Dependency Types:
- Finish to Start (FS): Task B starts after Task A ends
- Start to Start (SS): Task B starts after Task A starts
- Finish to Finish (FF): Task B ends after Task A ends
- Start to Finish (SF): Task B ends after Task A starts
Creating a Gantt Chart:
- List all projects and tasks
- Define start and end dates
- Identify dependencies
- Use spreadsheet software or specialized tools
- Add supplemental information as needed
Gantt charts serve as essential tools for project planning, monitoring, and communication. While they have limitations, their visual nature makes them invaluable for project management, especially when combined with other project management methodologies and contextual information.